Hidden downtime
See exactly when and how long each machine stops.
Connect old and new equipment without replacing it. See machine status, downtime, cycle activity and temperature in real time—from the factory floor or remotely.
Manual sheets and end-of-shift reports show problems too late. SmartIoT Systems automatically collects reliable signals directly from equipment, so production and maintenance teams can act while the shift is still running.
See exactly when and how long each machine stops.
Replace delayed, incomplete production logs with automatic data.
Give operators and management the same live information.
A compact monitoring module connects to available machine signals and sensors. Data is stored and converted into simple dashboards, alerts and reports.
Injection molding machines, presses, hydraulic systems and other production equipment.
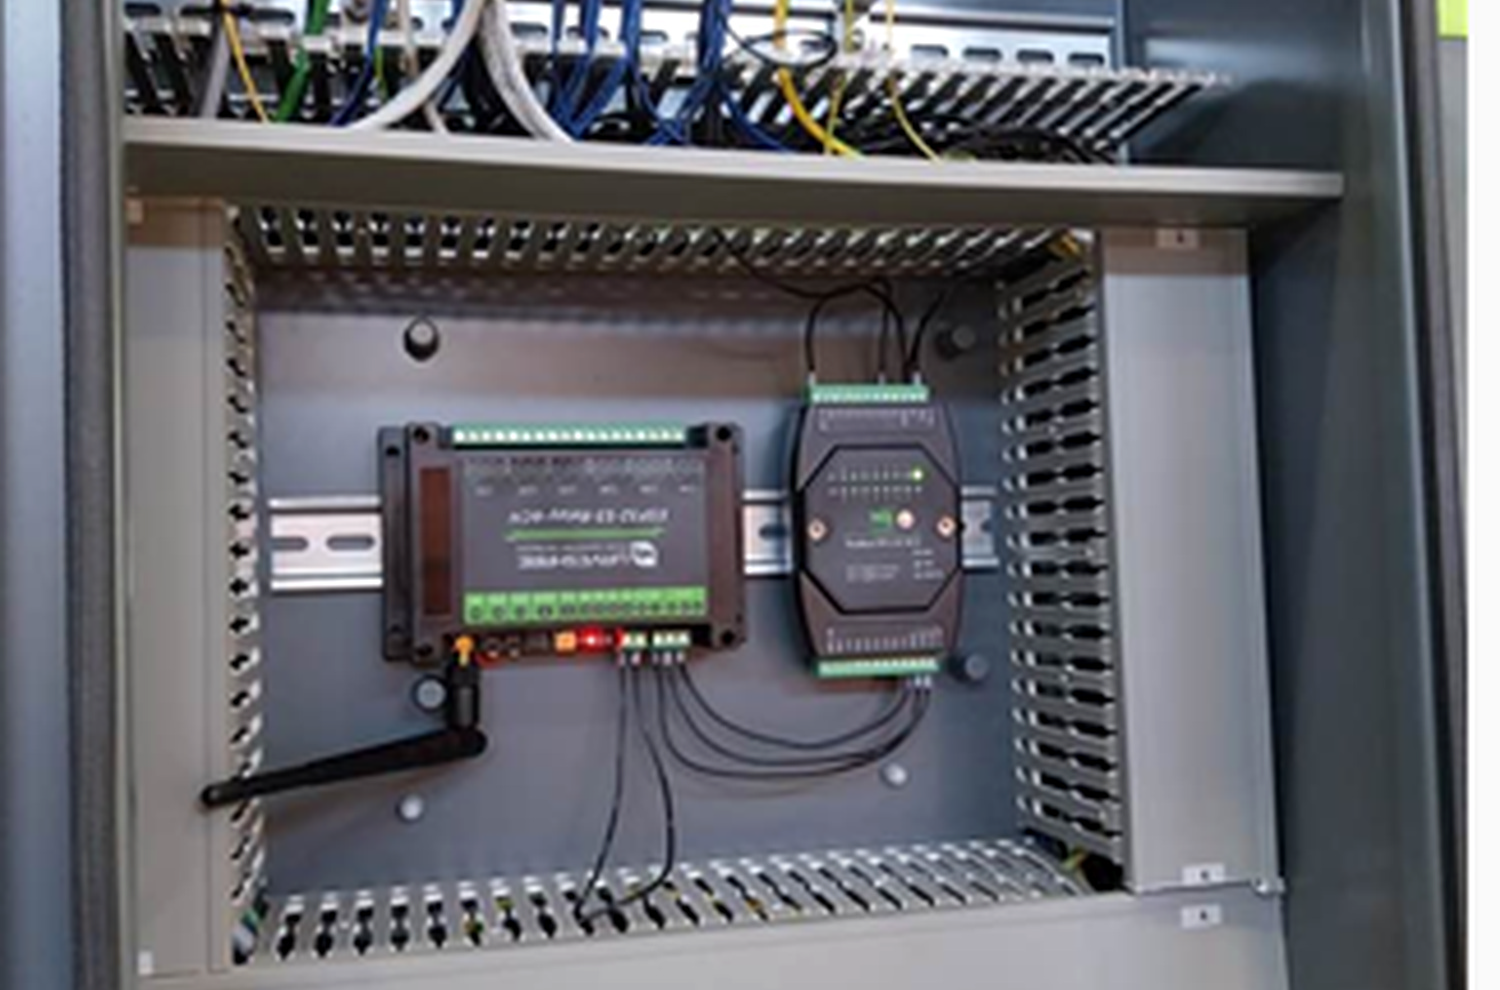
Run/stop signals, cycle activity, temperature and selected process values.
TV, PC and mobile dashboards plus daily or selected-period Excel reports.
Running and stopped state in real time
Duration, frequency and timeline
Trends and limit monitoring
Practical data for daily analysis
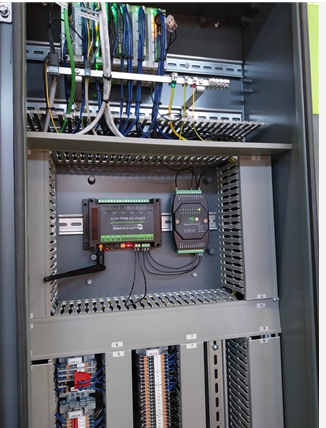
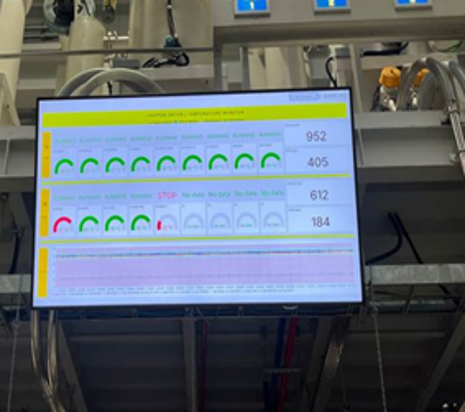
Real installation examples: a compact module inside the control cabinet, a production overview on the factory TV and automatically collected run/stop data in Excel.
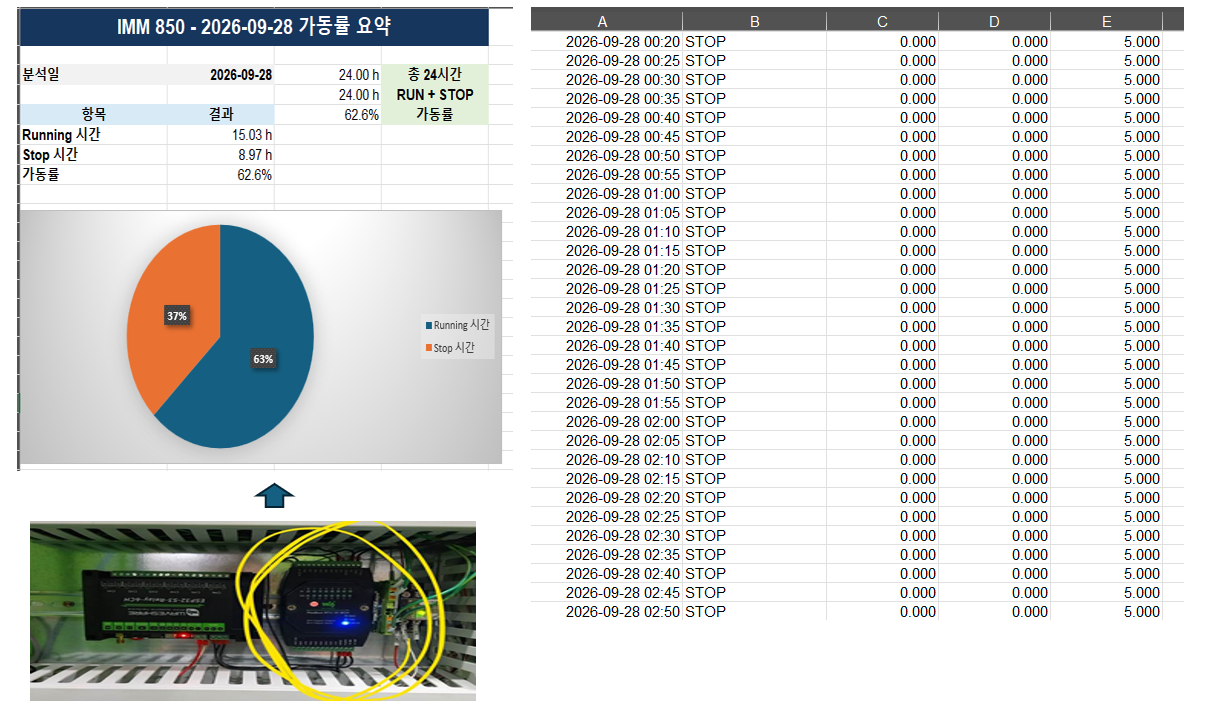
In this recorded 24-hour example, automatic monitoring separated actual running time from stopped time. The result gave management a factual baseline for production improvement.
We inspect the available signals, install a suitable monitoring module and verify the data with your team. Once the result is useful, the same approach can be expanded to more equipment.
Send the machine type, quantity and the information you want to see. We will suggest a practical pilot scope.